The Generative AI Report Sucks, Let’s Make It Brilliant
/ 8 min read

Summary
Google's Generative AI Report gives you visibility. That's it. But add commercial data and traffic dependency and you can. The practical question is what this changes for SEO, content quality, and AI search visibility.

For a long time, we have been operating in the dark regarding how generative AI features in search actually impact our traffic. When Google finally released visibility data, the initial reaction was relief. We could finally see if we were appearing in these AI driven experiences. This connects with AI Recommendation Sets Leave Some Brands Out when the same signal needs a clearer operating decision. A useful companion note is to Get Cited & Stay Visible, because it looks at a nearby part of the same system.
But the relief was short lived. Once you open the report, you realize it is missing the only metrics that truly matter for a business owner or a marketer: clicks and conversions. We have visibility, but we don't have a clear picture of loss or gain. To make this data useful, we have to stop looking at it in isolation and start layering it with our own internal business metrics.
The Gap Between Visibility and Value
The core problem is that Google is giving us a vanity metric. We can see impressions, but impressions are a fickle thing in the world of AI Overviews. According to guidance from John Mueller, an impression is counted if a link to your site is shown. However, there is a nuance here: links that are visible immediately count, while links that require a user to click an "expand" or "activate" button only count after that action occurs.
This means the data is a bit fuzzy. It tells us we are present, but it doesn't tell us if we are being seen or if we are being bypassed. If you rely solely on this report, you are seeing a shadow of your actual performance. It is a first party data source, which is valuable, but it is not a business intelligence tool.
The tradeoff here is between convenience and accuracy. The GSC report is convenient because it is right there in the dashboard, but it is inaccurate as a measure of risk. The decision you need to make is whether you are comfortable with a general sense of "presence" or if you need to quantify the actual financial threat to your bottom line.
What the Data Actually Tells Us
If we are being honest, the report shows visibility and nothing else. It does not show exposure, risk, or commercial value. To move from "visibility" to "exposure," you have to understand how the AI is intercepting your specific traffic and the value associated with that traffic.
To build a real model of your exposure, you cannot rely on one tool. You need to synthesize data from several sources:
The Generative AI report in Search Console. Google Analytics 4 (or your preferred analytics tool) for audience behavior. Internal commercial data, such as revenue, lead volume, or subscription counts. Third party data on how often AI Overviews actually trigger for your top queries. Server logs to track AI crawler activity. The same pattern also shows up in to Monitor Generative AI Prompts More Accurately, where the practical question is how the signal becomes visible.
While server logs are an optional addition, they provide a proxy for demand that GSC cannot. By layering these, you stop guessing and start calculating. The risk is that many teams stop at the GSC report because the effort to merge these datasets is high, but the reward is the only way to actually protect your revenue.
A Framework for Measuring AI Exposure
Since the native reporting is half baked, we have to build our own diagnostic layer. The goal is to move from a site wide average to a granular understanding of which business units are most vulnerable.
Extracting Data from the GSC Aggregate
Start by taking your total sitewide AI impressions and exporting the page level data. There is a significant catch here: the thousand row limit. If your site is large, the export is a sample, not a complete record. This is a critical detail because if you ignore the limit, you might miscalculate where your visibility is concentrated.
To get around this, I suggest exporting data at the subfolder level. By creating separate properties for different sections of your site, you can bypass the row limit and get a more accurate aggregate. This allows you to classify URLs by content area, which is the only way to make the data meaningful for a business.
Analyzing Visibility Concentration
Once you have the data organized by section, you can identify where the AI is focusing. You want to answer a few specific questions: Is the visibility spread thin across thousands of pages, or is it concentrated on a few "power pages"? Which sections of the site are the primary targets for AI Overviews?
You should look at the intensity of this visibility. If a small handful of pages are driving the majority of your AI impressions, those pages are your primary points of failure. If those pages also drive the most revenue, you have a high concentration of risk.
The danger here is treating all AI visibility as equal. A thousand impressions on a "What is." informational page is very different from a thousand impressions on a "Best tools for." commercial page. You must distinguish between the two before deciding on a strategy.
Integrating Commercial KPIs
This is where the analysis becomes a business tool. You need to map your AI visibility against a primary commercial KPI. This could be revenue, leads, or conversions. The specific metric is less important than the consistency of its application across all subfolders.
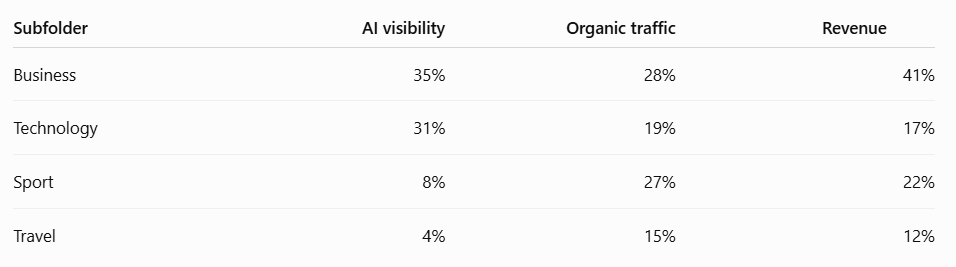
When you overlay this, the picture changes. You might find that a section with high AI visibility actually generates very little revenue, meaning the "risk" is low. Conversely, you might find a section with low AI visibility that generates the bulk of your profit. That section is your "safe zone" for now, but it also tells you where you cannot afford to lose ground.
The tradeoff here is the time it takes to clean commercial data. It is tempting to use "traffic" as a proxy for value, but traffic is not revenue. If you want a rigorous assessment, you must use actual business value.
Evaluating AI Substitution
To take this further, you need to know if the AI is actually substituting the click. This requires third party SERP data to see how often an AI Overview triggers for your most important keywords. While you cannot prove a click was "stolen" without expensive user testing, you can prove that the search landscape has changed.
If a query that used to lead directly to your site now triggers a complete AI answer that satisfies the user's intent, that is a substitution signal. This is an enhancement to your model, not a requirement, but it provides the "why" behind the numbers you see in GSC.
The Role of Server Logs
Server logs are often overlooked because they look intimidating, but they provide a layer of granularity that is impossible to find elsewhere. They allow you to see exactly which AI crawlers are hitting your site and what they are accessing.
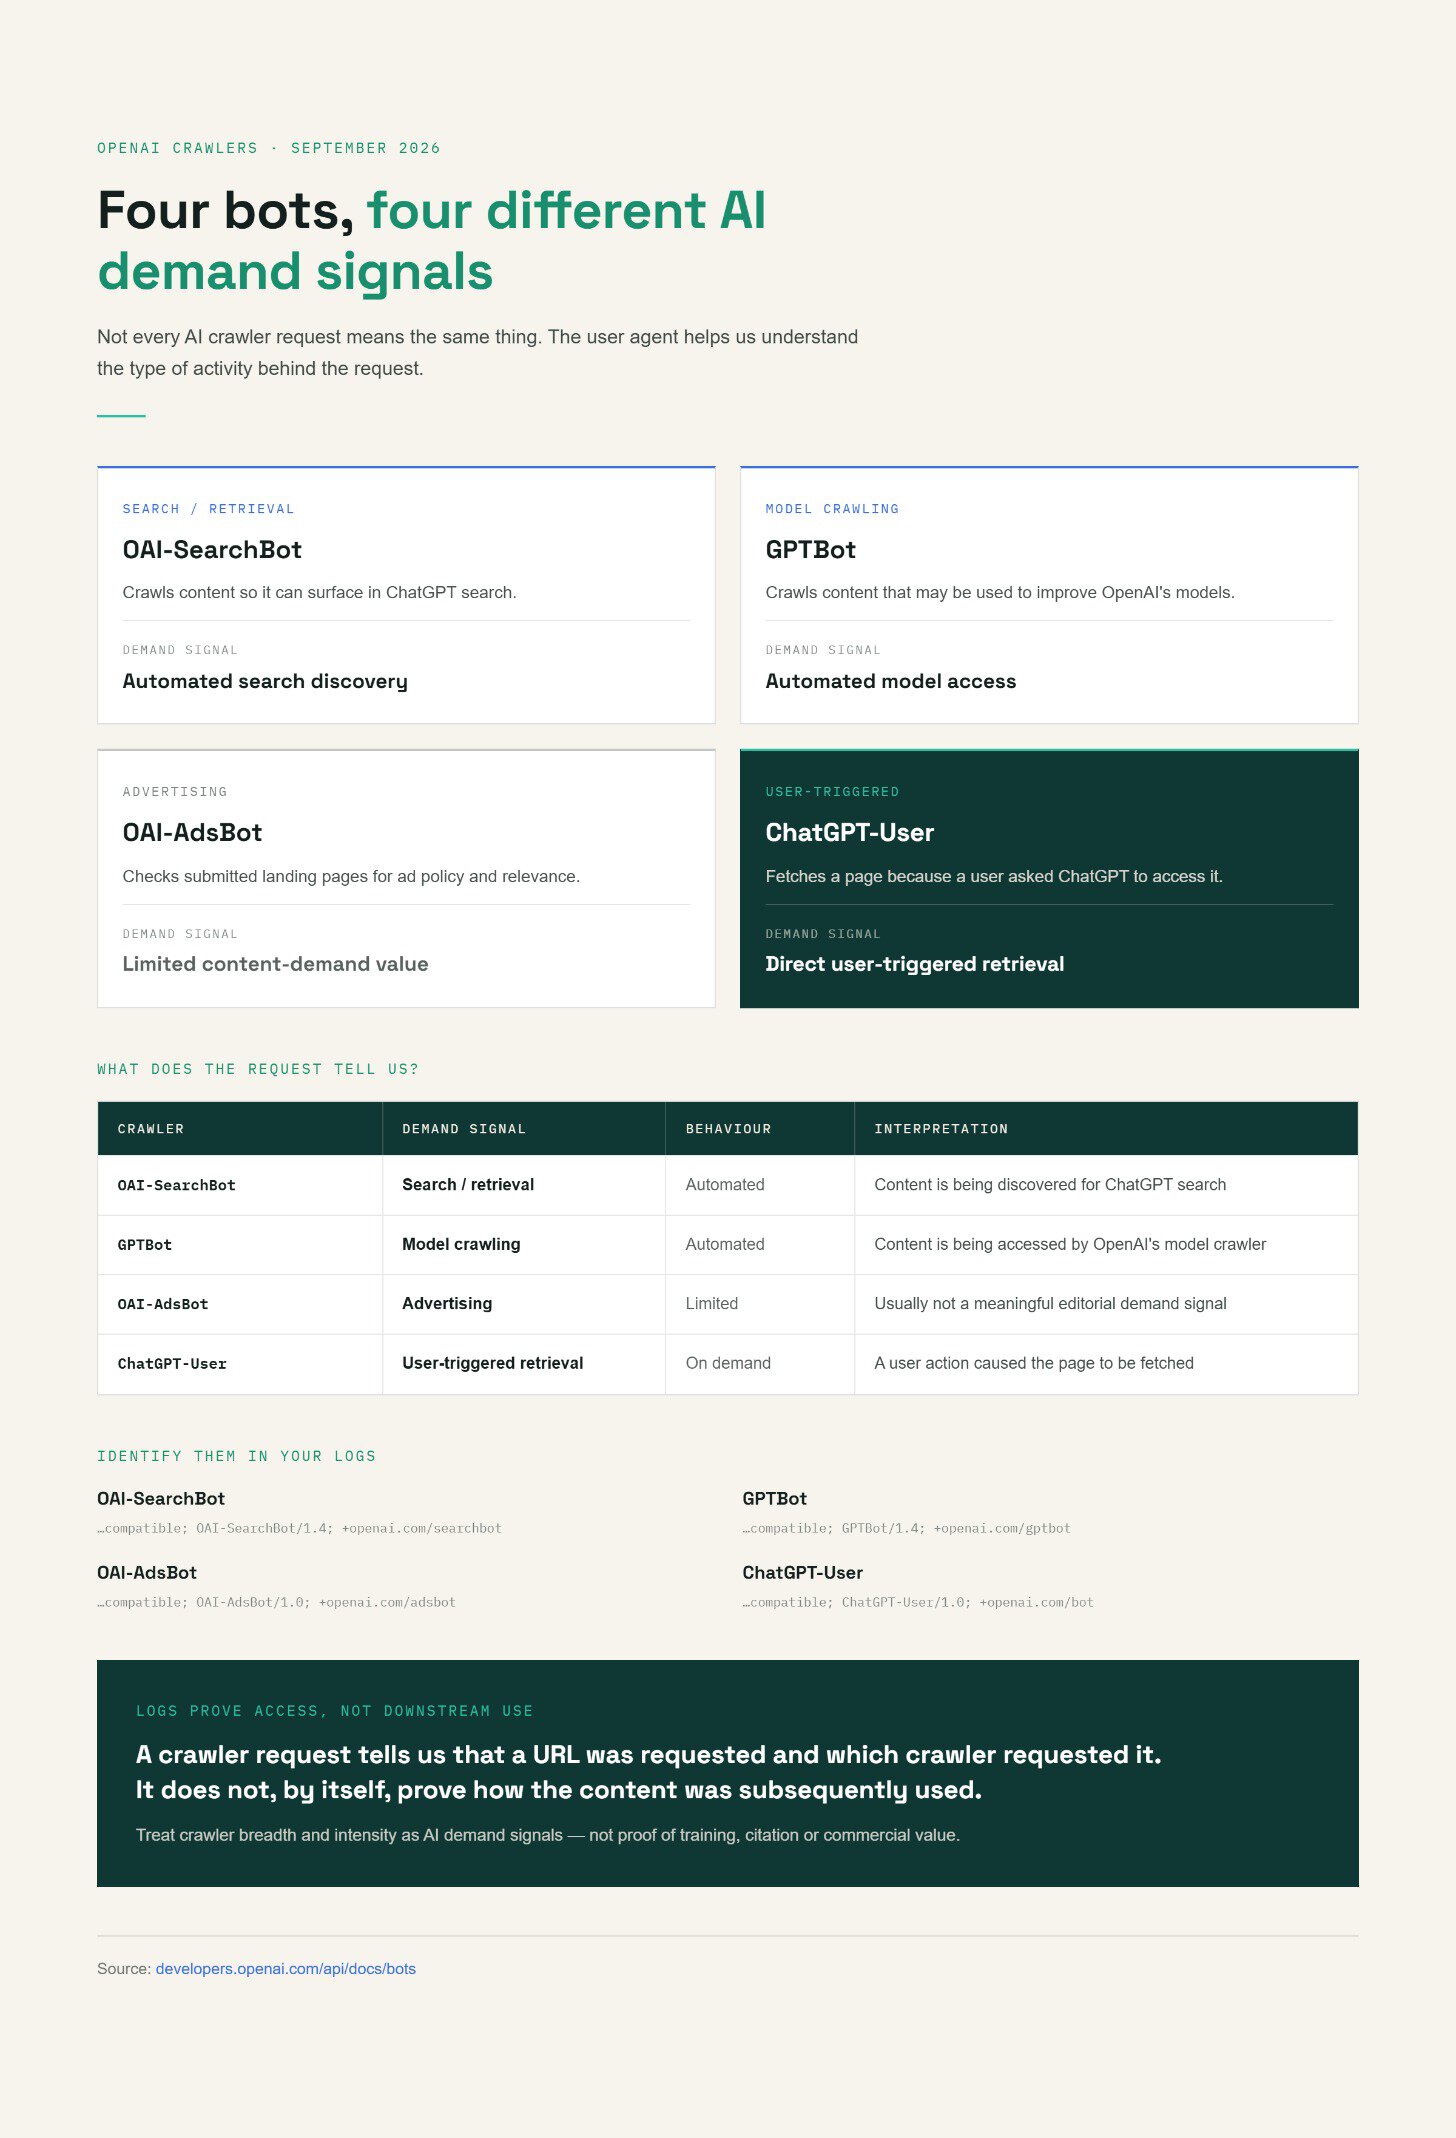
It is important to distinguish between different types of bots. Training bots, search bots, and retrieval bots all have different intents. A retrieval bot hitting a page frequently suggests that the content is being used to fuel real time AI answers. This is a demand signal.
One major caveat: access does not equal usage. Just because a training bot crawled a page does not mean that content was successfully integrated into a model. However, knowing that your high value proprietary data is being hammered by bots is essential information before you decide whether to block them or seek licensing.
Building the Commercial Exposure Model
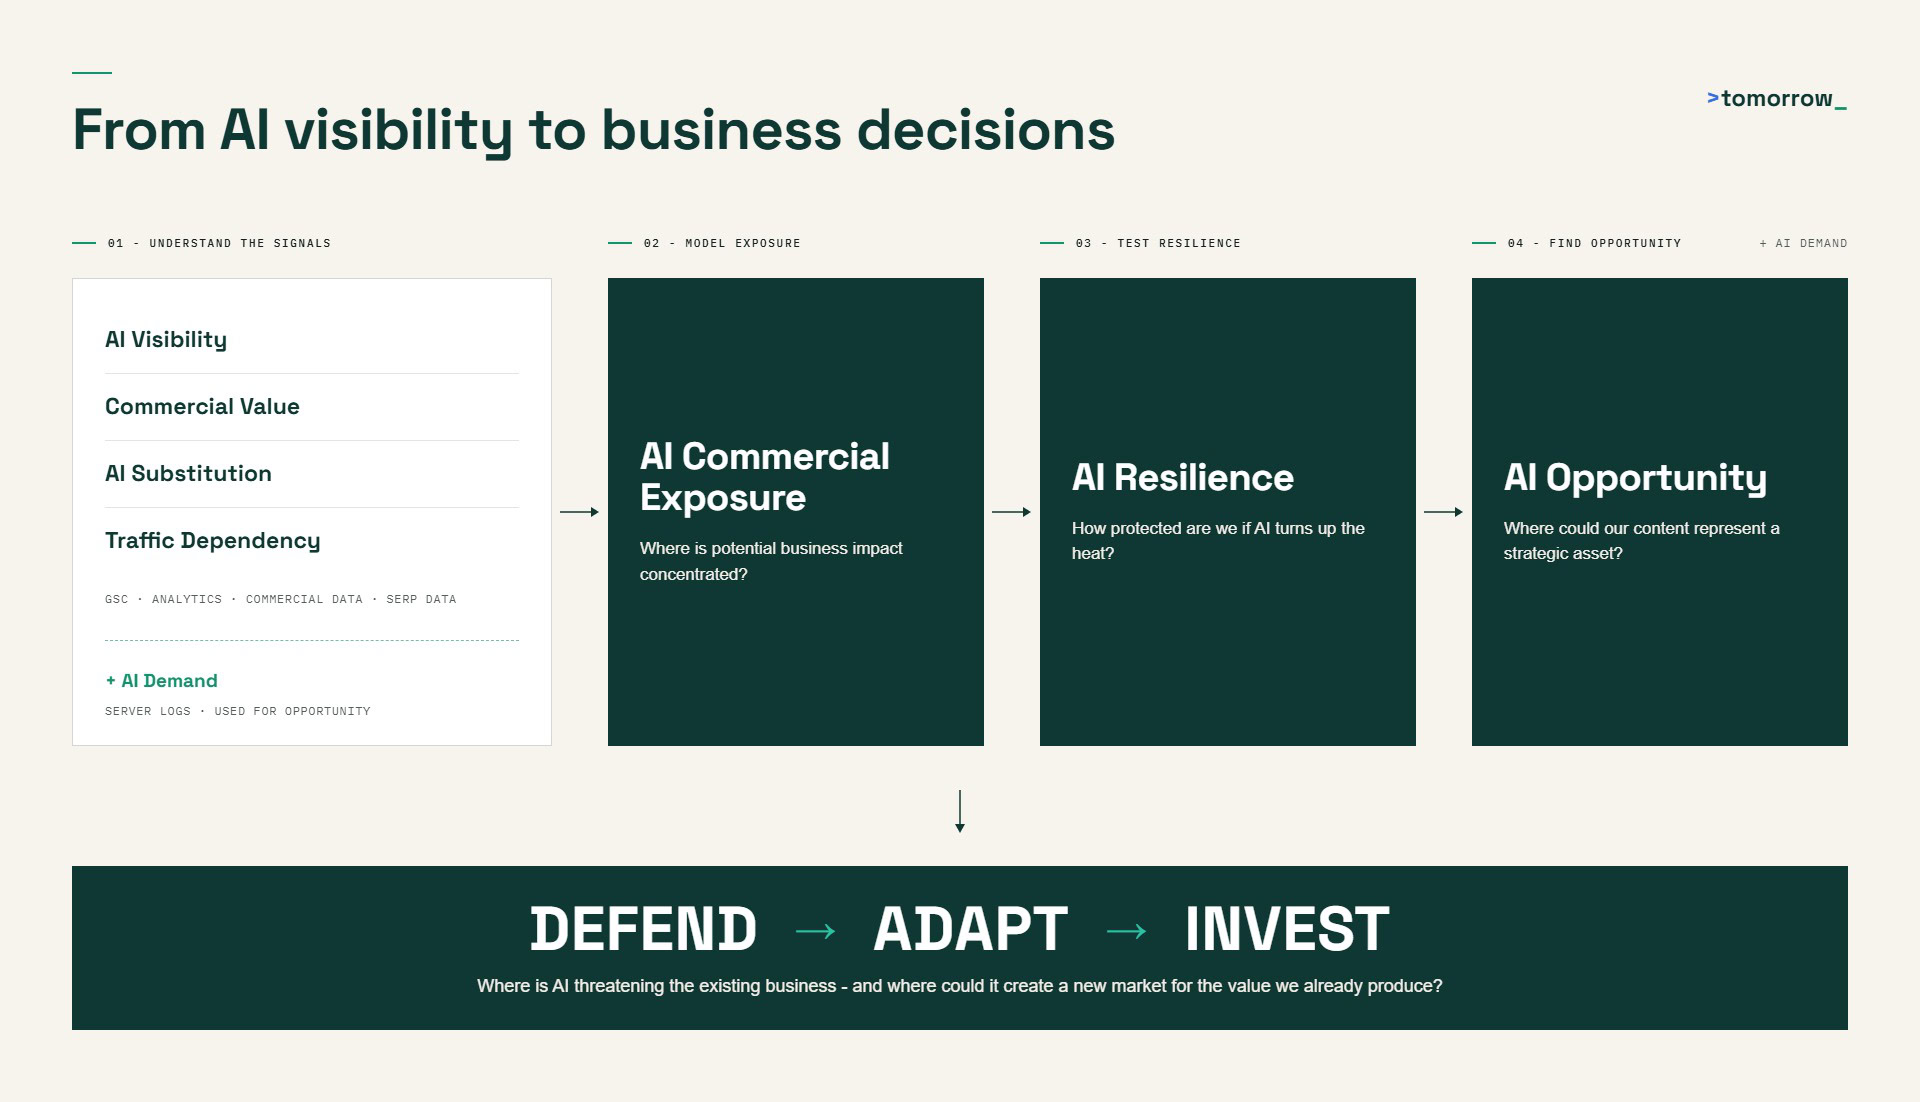
To bring this all together, you can create a Commercial Exposure Model. This requires four primary inputs, which I recommend normalizing on a scale of 0 to 100 to keep the math clean:
AI Visibility (V): Where the AI is most present on your site. AI Substitution (S): The prevalence of AI Overviews for your key queries. Traffic Dependency (T): How much of that section's traffic comes from organic search versus direct or branded sources. Commercial Value (C): The actual business value generated by that section.
By combining these, you can calculate a score that represents your actual exposure. A section with high visibility, high substitution, and high organic dependency is a high exposure zone. If that zone also has high commercial value, you have a critical business risk.
The decision point here is how to weight these factors. Some businesses may prioritize traffic dependency more than others. The goal is not a perfect number, but a relative ranking of risk across your content areas.
Measuring Your Resilience
Exposure is not the same as risk. You can have high exposure but high resilience. Resilience is your ability to withstand a drop in organic search traffic without the business collapsing.
To measure resilience, look at the following:
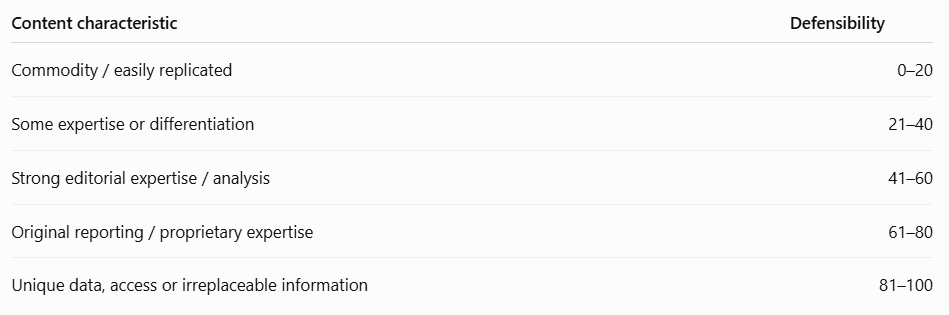
Branded Search: How many people are searching for you by name? Direct Audience: How many users come straight to your URL? Content Defensibility: Is your content based on proprietary data or unique insights that an AI cannot easily replicate?
If you have a loyal, direct audience and a strong brand, your resilience is high, even if your AI exposure is high. If you are entirely dependent on "how to" queries that AI can answer perfectly, your resilience is low.
The tradeoff is that building resilience takes years, while exposure can change in a single Google update. The strategy should be to increase resilience in the areas where exposure is highest.
Identifying the AI Opportunity
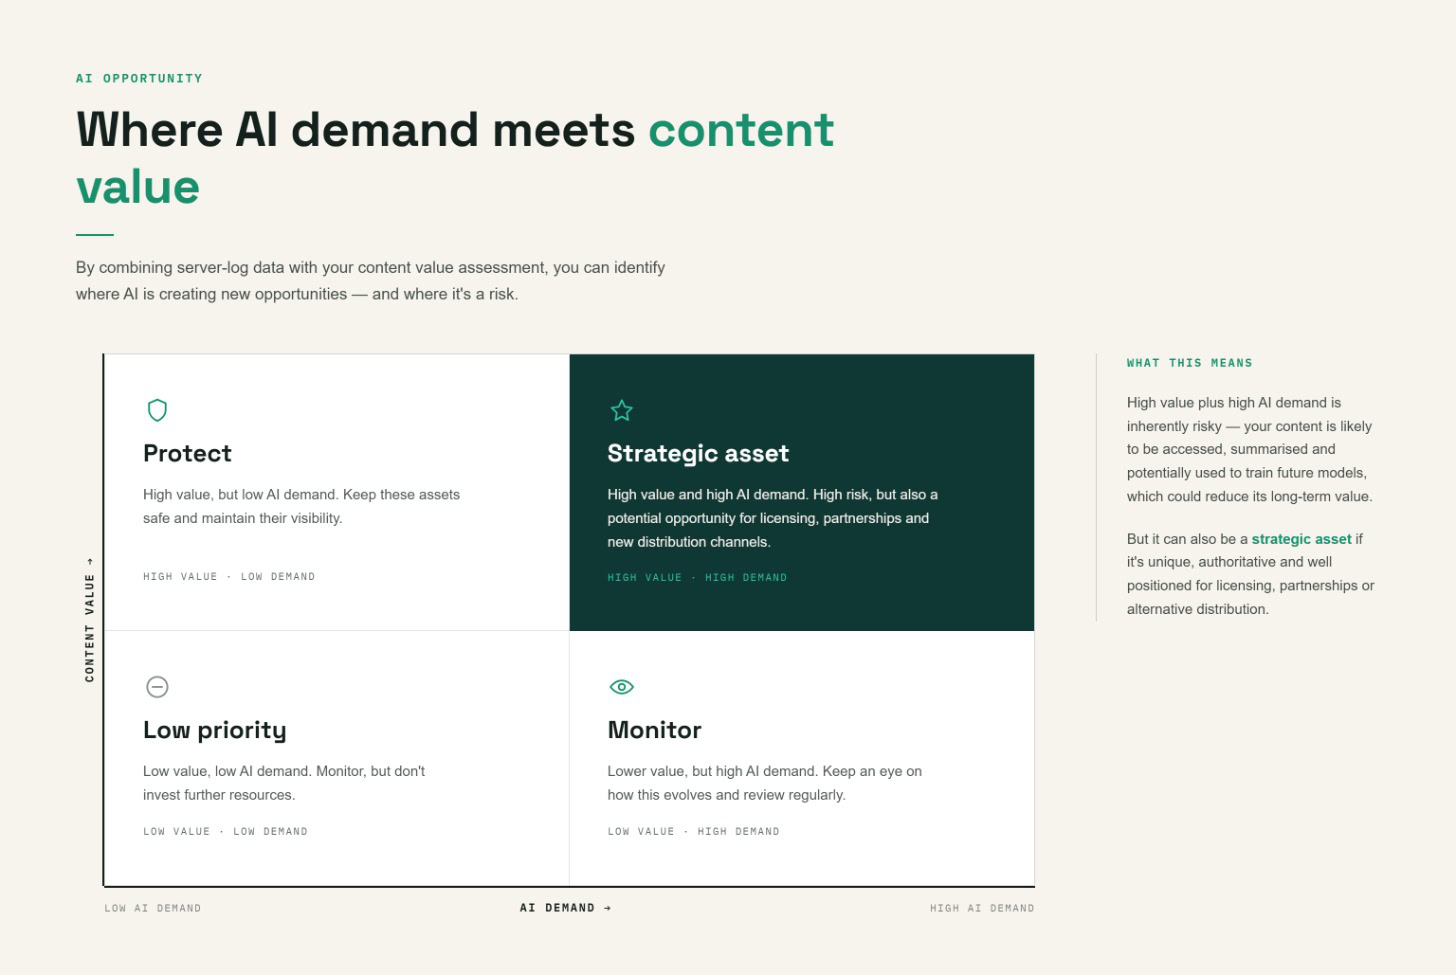
Finally, it is worth considering that AI is not just a threat, but a potential revenue stream. By mapping server log data to your most valuable content, you can identify where AI systems are most dependent on your data.
If you see high frequency and breadth of access from retrieval bots on your most proprietary content, you have use. This data is the foundation for decisions regarding bot blocking, content licensing, or strategic partnerships.
The risk is blocking bots blindly to "protect" content, only to find you have removed yourself from the AI ecosystem entirely. The goal is to use the data to decide whether to open the doors or put up a paywall.
Comments
Comments are reviewed before they are published. Links are not allowed inside comments.